Getting Started With Locust: A Python Based Performance Testing Tool
Last year in one of the consulting assignments, I was asked to perform performance testing on an application using locust, client wanted to integrate load testing within backend code which was written in python.
Initially, I suggested JMeter but the client said a valid point that they want something that can easily be maintained by developers later on without much training.
I understood their point and started looking for python based load testing tool and within seconds I stumbled upon “Locust”. While Usage of this tool still quite low compare to other popular tools in this domain such as Jmeter, Loadrunner and Gatling but in terms of features, it is just as good as others.
Of course, being new and open source tool, it does have limitation but good part it, since it is pure python programming based tool, whatever is missing can easily be achieved through custom code and python third party libraries.
So in this locust series, We will discuss various ways to perform different types of performance testing and some common solutions to problems that I faced during my assignment.
Let’s start with a quick HTTP request test using the below steps…
- Installation
Installation is pretty easy, you just need to run one single command, please note latest locust version required python 3.6 version or above.
pip3 install locust
2. Writing a quick load test of testautomasi home page in a python file:
from locust import HttpUser, task, between

class QuickLoadTest(HttpUser):
    wait_time = between(1, 10)

    @task
    def test(self):
        self.client.get("/")
Explanation of code: A class QuickLoadTest is created which extends the HtppUser locust class which has all the methods related to HTTP request testing as it is built on top of the python-requests module.
wait time is kind of a uniform random timer if you compare it with JMeter, which pauses threads for a random time interval which is between 1 to 10 in this case.
task annotation is like an HTTP request sample in Jmeter, under which you can write code to test one request or application flow with custom logic. Here, we are hitting the homepage(the base URL will be given during runtime) with the “get” method type.
3. Running test
Running this test is very straightforward, save the step 2 code as python file then open terminal/command prompt and run below command:
locust -f ".\locationoffile.py"
After that, browse to locust web interface for providing base URL and thread count, by default at http://localhost:8089

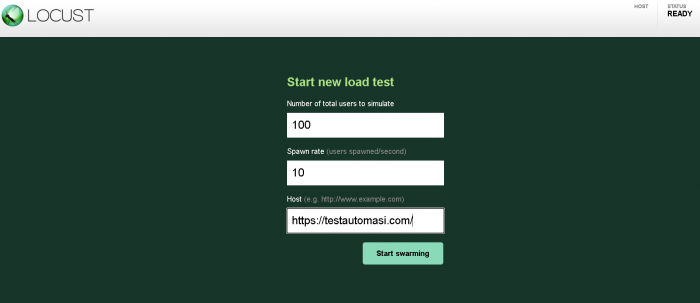
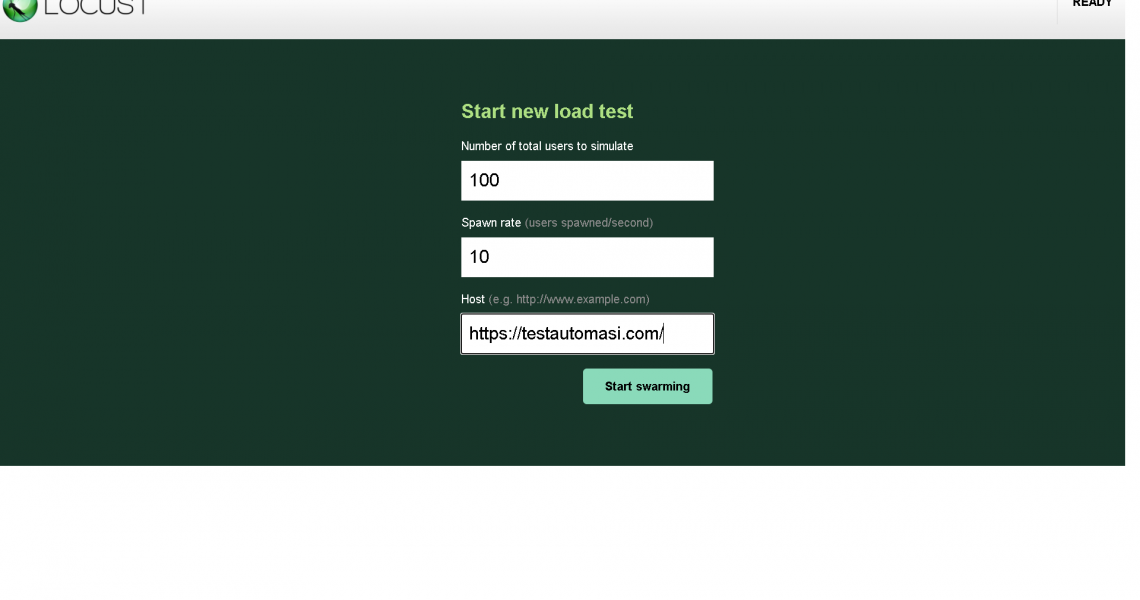
Thread count is equivalent to the number of users in the locust, the spawn rate is equivalent to the ramp-up period in JMeter where 10 means, 10 threads will become active in 1 second till the total thread count reaches 100.
Host means the base URL/application URL, in this case, we are using testautomasi.com for demo purposes.
4. Viewing Results/Metrics:
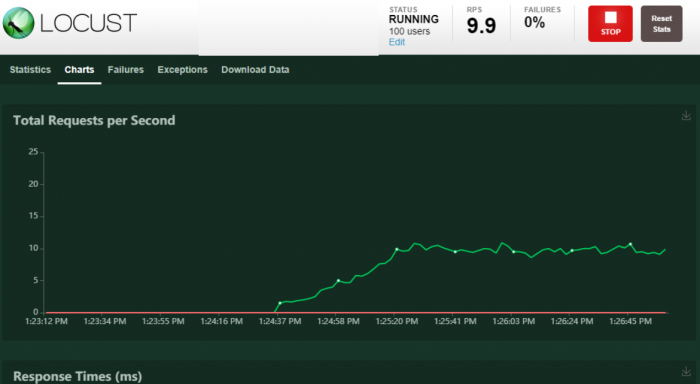
Once you start tests, results can be viewed in real-time on the locust web interface in form of statistics, charts, failures, exceptions, and CSV data as shown below:

If you notice the above image closely, in locust, you can change thread count during runtime as well using the edit link just below status section, which isn’t possible in many other performance testing tools.
CSV report also produces data like summary report listener in Jmeter, you can download and view results metrics or send it to higher management/ Developers to take actions.
So That’s how you can use locust to perform your performance testing tasks, quite easy right?, Let’s discuss some more cool stuff about locust in upcoming articles, please leave your feedback about locust in the comment section.
